MorisLens
Mauritius through data.
MorisLens makes official statistics on Mauritius easy to explore, compare and understand, on subjects such as road safety, tourism, the economy and employment, with the source of every figure.
How it works
01
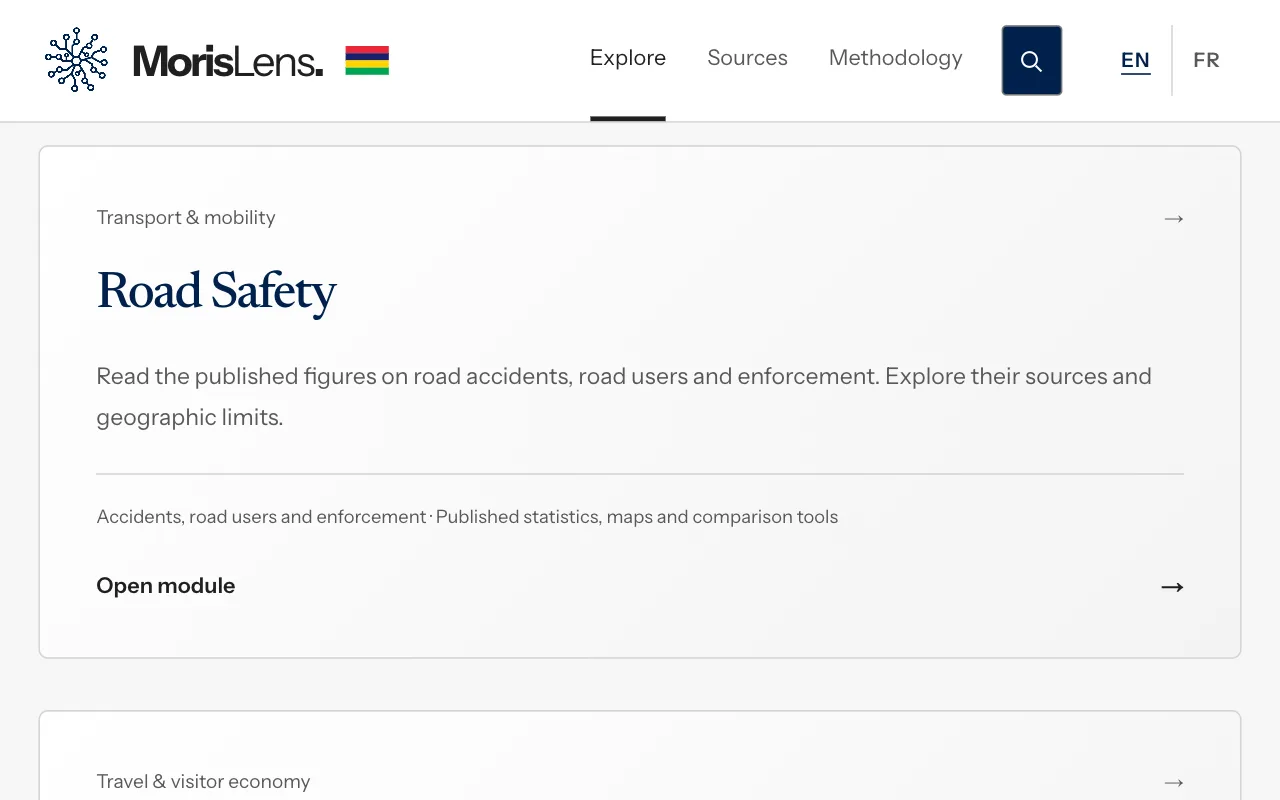
Choose a subject
Each subject brings its published series together in one place.
02
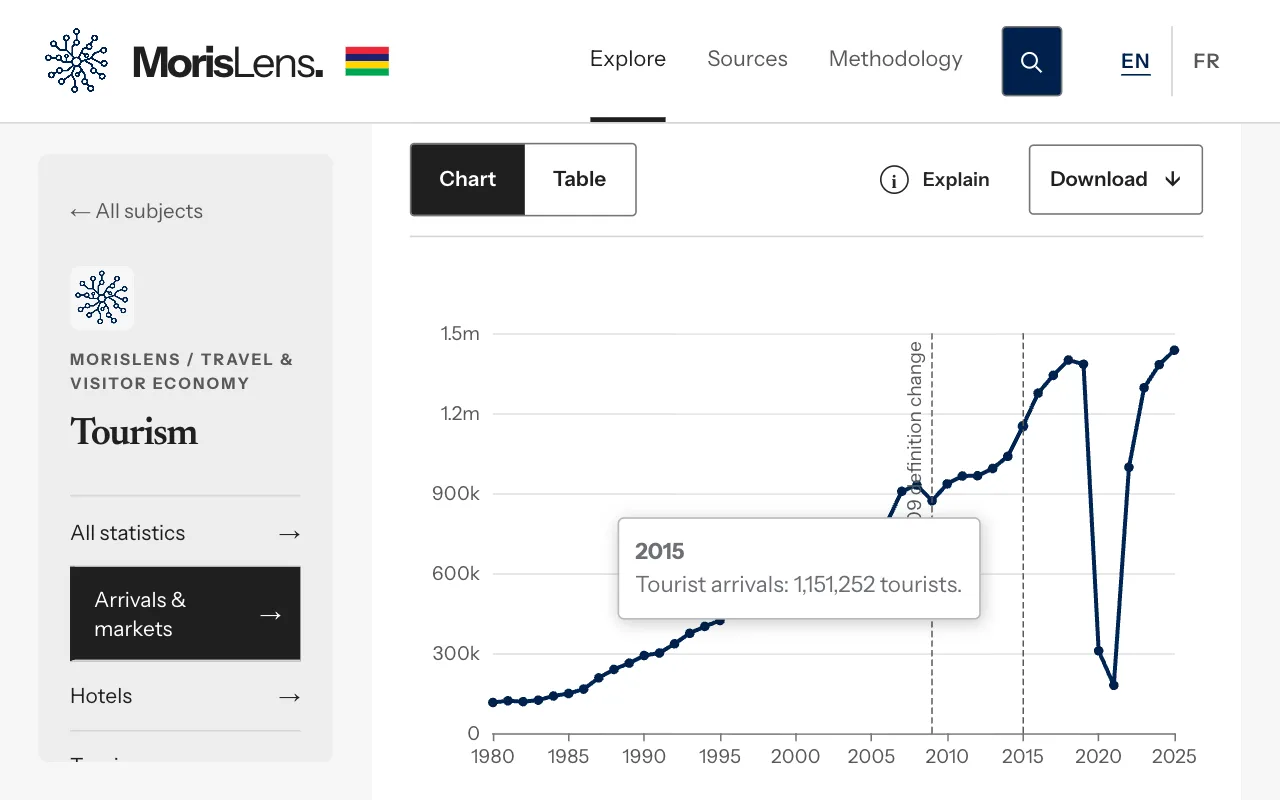
Read the chart
The full history of each series, value by value, with provisional figures marked.
03
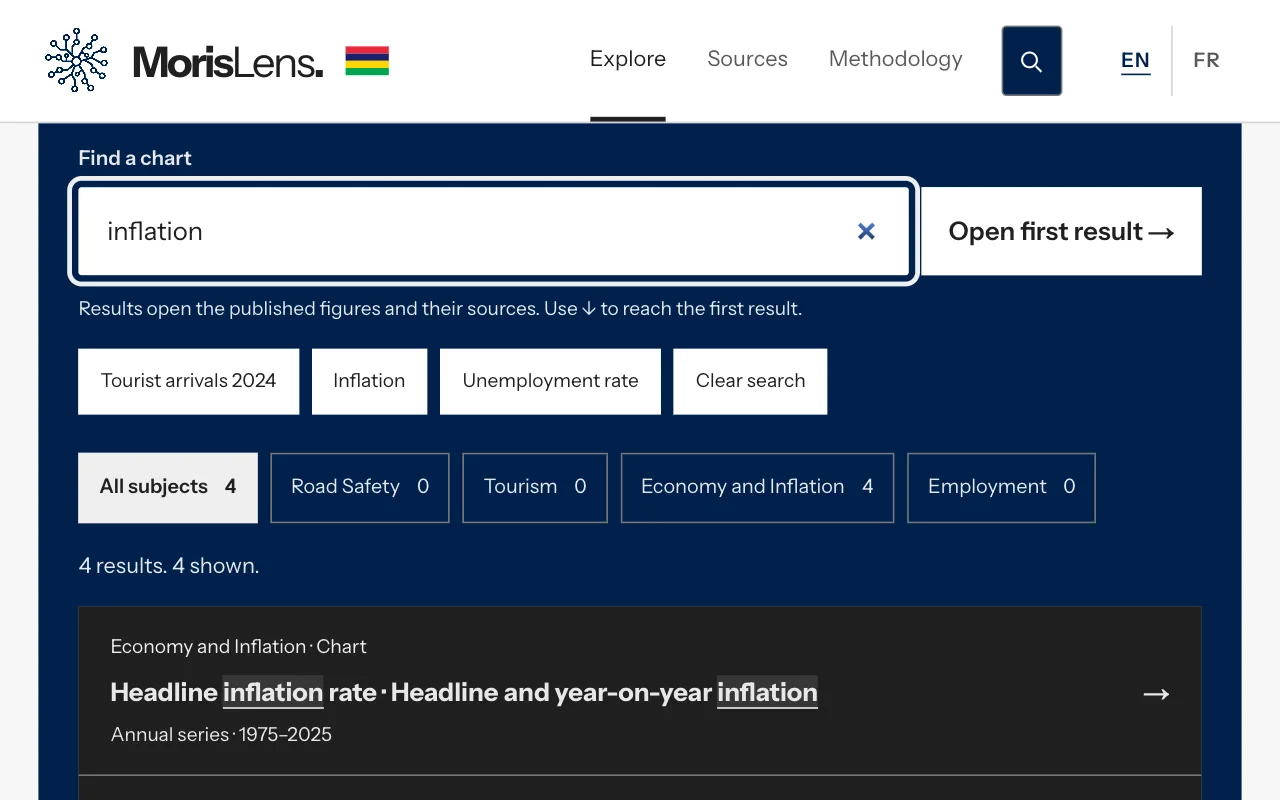
Find any indicator
Search in English or French, then open the chart and its data table.
Who it is for
Journalists
Check a figure and its source before publishing.
Students and researchers
Long series ready to compare, with the official reference.
Decision makers
A quick, sourced picture of tourism, the economy and employment.
How it is built
Imports from official publications with a check on every file, calculations on the server, a fast public interface and hosting on a dedicated server.
Where it stands
Live public project
Online since September 2026, with real official data, in English and French.
Data & Analytics · Software Engineering & Deployment
Questions
Where does the data come from?
From official publications on Mauritius. Every chart links back to its source.
Is it free?
Yes. MorisLens is a public website, open to everyone.
Can I reuse the charts?
Charts export as images and tables as PDF, with the source credited. The reuse terms are on the site.
Next product
IRIS
You look after your clients. IRIS looks after the front desk.

Contact
Discuss your project.
Tell us about the problem you are facing and the data it lives in. We read every message and reply personally.
Prefer email? contact@skvision.mu